My Dashboards
A Dashboard is a board of pinned Insights, KPI tiles, and record grids that you arrange freely. You keep it open to monitor spend over time.
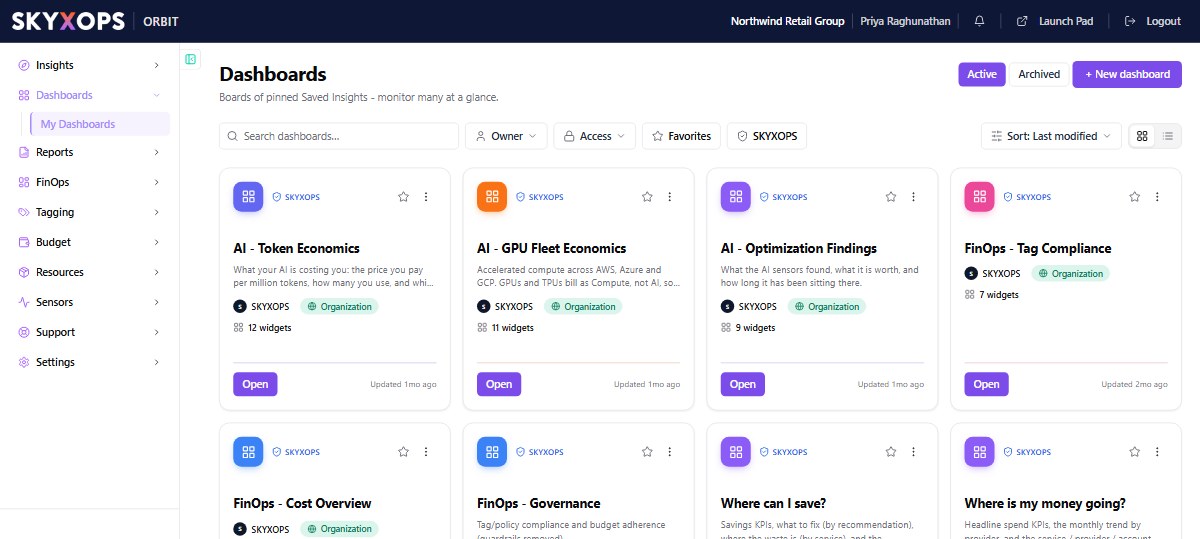
The gallery
Dashboards > My Dashboards lists every board you can see. From here you can:
- Search and filter by Owner, Access, or Favorites.
- Toggle Active / Archived.
- Sort (for example by last modified or name) and switch between grid and list views.
- Open a board, or create one with + New dashboard.
Each card shows the board's owner, its access scope (e.g. Organization), the widget count, and when it was last updated. Star a board to pin it to your favorites.
Building a board
Open a board and arrange it:
- Pin an Insight as a widget from Explore with Save / Export > Pin to a Dashboard.
- Drag tiles to rearrange them, and resize them.
- Edit the board title and description in place.
System boards
Some boards are standard (SKYXOPS-defined) and pinned into the navigation, for example the FinOps boards. They open read-only. Use Save / Export to make your own editable copy.
FAQ
What's the difference between a Dashboard and a Report?
A Dashboard is live and interactive; a Report is a frozen, point-in-time document meant to be shared or archived.
Who can see my board?
Its access scope controls visibility (e.g. just you, or your whole Organization). Sharing is also governed by your access level.