Explore
Explore is Orbit's live query builder. Pick a measure, break it down, and filter. A chart and table render as you build. Nothing is saved until you choose to save it.
The flow is always the same: explore, then save as an Insight, then pin to a Dashboard (monitor) or export a Report (share).
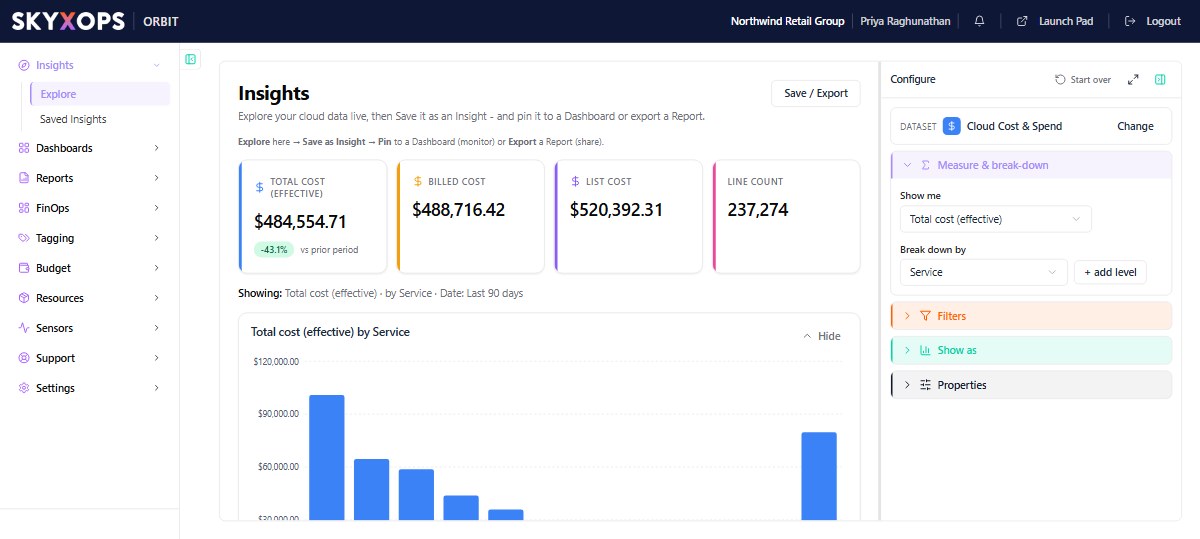
Build an Insight
The Configure panel on the right drives everything:
- Under Dataset, choose what you're exploring. Cloud Cost & Spend is the default; Cloud Resource Inventory (CMDB) powers the Resources view.
- Pick the measure under Show me. For cost, start with Total cost (effective) (see How Orbit calculates cost).
- In Break down by, set the grouping dimension (Service, Provider, Account, Region, Virtual Tag, …). Use + add level to nest a second break-down.
- Use Filters to narrow to a provider, service, date range, or tag value.
- Pick the visualization in Show as: bar, line, area, pie, or table.
- Once a chart is showing, the Properties section appears. Use it to fine-tune the chart (see Fine-tune with Properties).
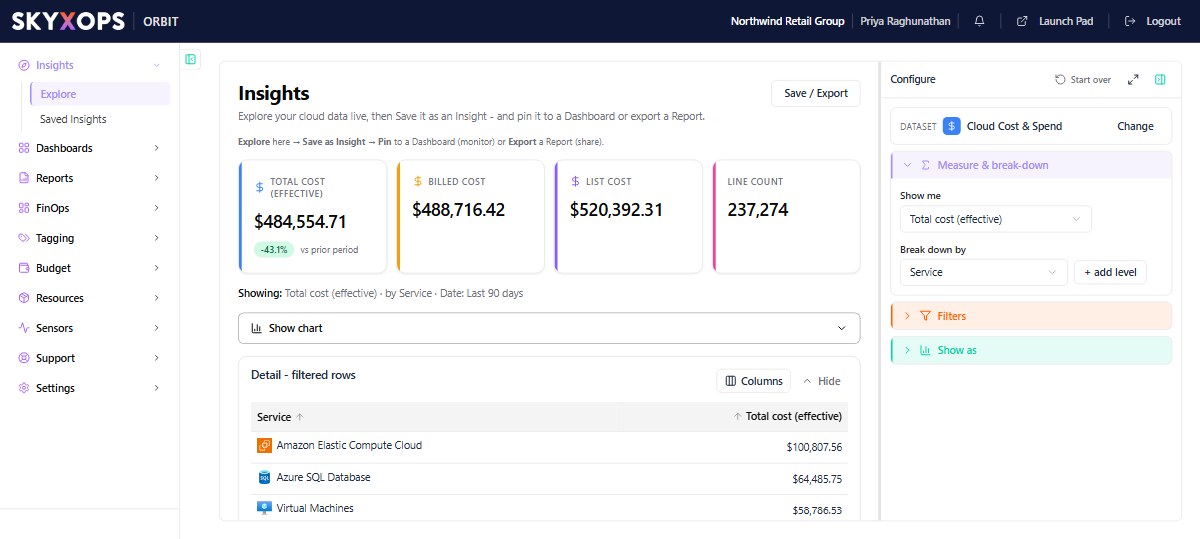
As you configure, Orbit shows KPI cards (effective, billed, list, line count), the chart, and a Detail table you can drill into.
Fine-tune with Properties
Once a chart is rendered, a Properties section appears in the Configure panel. It's chart-aware: the options change to match the visualization you picked (a pie shows slice-label options, a table shows row/column options, a bar shows bar width, and so on). Properties are grouped:
| Group | What you can set |
|---|---|
| General | Title and Subtitle shown above the chart (blank = auto-generated). |
| Data & limit | Show the top N categories (Top 5 to 50, or Show all), Sort biggest- or smallest-first, and Group rest as "Others" (fold or hide the long tail). |
| Format | Numbers: Default, Currency ($1,234), Compact ($1.2K), or Plain. |
| Axes & legend | Axis label, Data labels (print the value on each bar/point/slice), Gridlines, Category labels (Auto / Show all / angled), and, for pie, Legend, Value in legend, and what the slice label shows (% or value). |
| Grid (table view) | Search bar, Totals row, Rows per page, and a per-column Filter bar. |
| Series | Bar width (bar charts), Smooth curve (line/area), and Show points (line). |
These are display-only tweaks. They change how the Insight looks and leave the data it pulls unchanged. They're saved with the Insight and travel with it onto a Dashboard or into a Report.
Save, pin, or export
Use Save / Export (top-right) to keep your work:
| Option | What it does |
|---|---|
| Save as Insight | Stores the exploration so you can reopen and drill it later. |
| Pin to a Dashboard | Adds it as a widget on a board to monitor over time. |
| Export as a Report | Freezes it into a point-in-time Report to share. |
The full configuration is encoded in the URL, so any Explore view is shareable as a link.
Saved Insights
A Saved Insight is an Explore view you've kept. It stores the query (dataset, measure, break-downs, filters, and visualization). It does not store a frozen snapshot, so every time you open it, it runs live against current data. Open Insights > Saved Insights to see your gallery, then click any one to reopen and drill it. You pin Saved Insights to Dashboards and export them as Reports.
Some Insights are standard (SKYXOPS-provided and read-only), for example the Resources (CMDB) view. Use Save / Export > Save as Insight to keep your own editable copy.
FAQ
Does anything persist automatically?
No. Explore is a live scratchpad. Use Save as Insight to keep a view.
Why don't my totals match another page?
Check the measure (effective vs billed vs list) and the date-range filter. Both change the number.
Can I break down by a tag?
Yes. Break-down and filters include your Virtual Tags, so you can slice by business concept as well as by raw cloud tags.