Cost Overview
Cost Overview summarizes your cloud cost, and it is the first FinOps board most people open each morning. It's a standard SKYXOPS board that reads live effective-cost data.
What's on the board
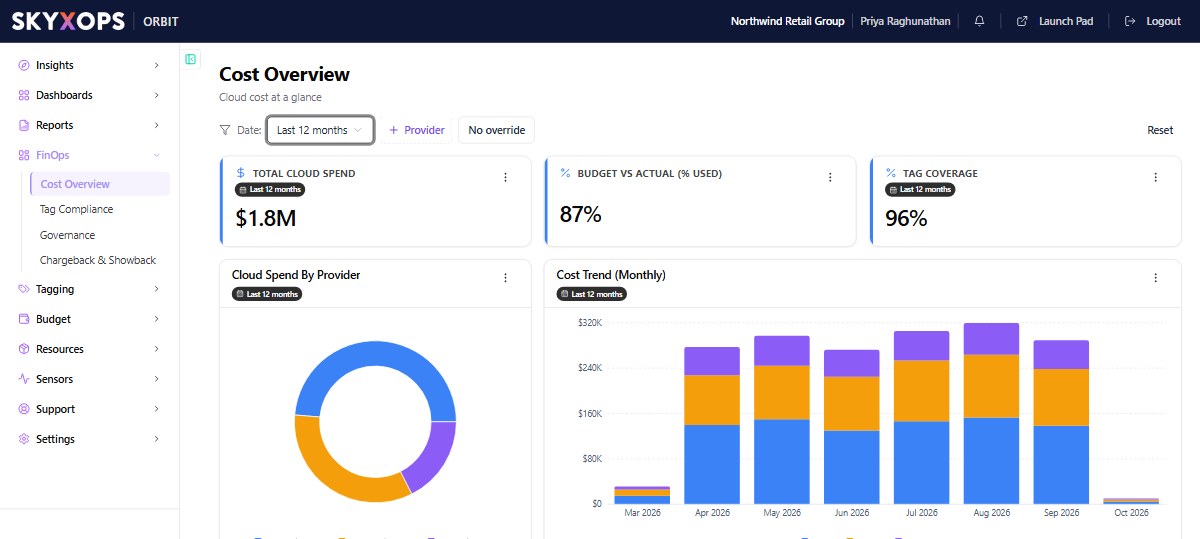
The board has KPI tiles for Total Cloud Spend, Budget vs Actual (% used), and Tag Coverage. Cloud Spend by Provider shows how spend splits across AWS, Azure, and GCP. Cost Trend (Monthly) shows spend over recent months, stacked by provider.
Filters
The board filter bar lets you scope by:
| Filter | What it scopes |
|---|---|
| Date | The reporting period. |
| Provider | One or more clouds. |
| No override | A button that clears the date you picked, so each tile goes back to its own date range. |
The other FinOps boards
Cost Overview is one of several curated FinOps boards in the app. Alongside it you'll find Tag Compliance (how well is my spend tagged?) and Governance (are we within policy and budget?). Both are read-only boards built on the same effective-cost data. Open them from FinOps in the left nav.
Chargeback & Showback (who owns which costs?) also appears under FinOps, but its board isn't built yet. The entry currently opens a coming soon page. In the meantime, allocate shared spend with Virtual Tags and report on it from Explore.
FAQ
Can I customize this board?
The Cost Overview page is read-only. To explore one tile's data, open the tile's menu and choose Open in Insights. From there you can save your own Insight. To get an editable copy of the whole board, open it from My Dashboards, where it is listed as FinOps - Cost Overview, and choose Clone to customize.
Which cost number is "Total Cloud Spend"?
Effective cost. See How Orbit calculates cost.